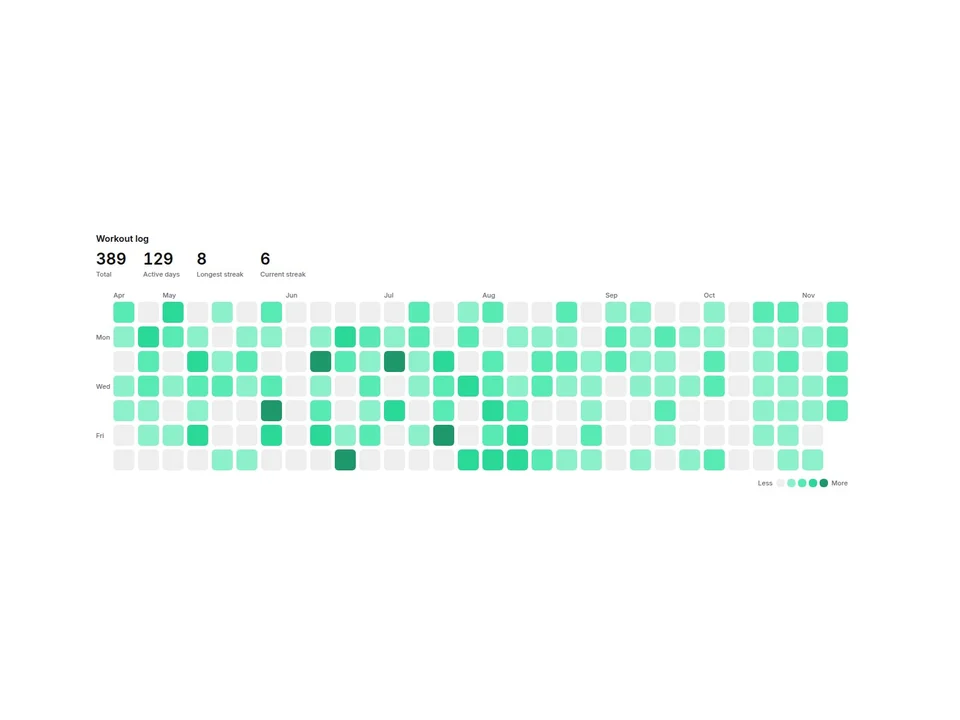
What it does
A contribution-style calendar heatmap that runs on your own data. Type or paste one day per line (2026-03-14, 5) and each day becomes a colored cell: workouts, sales, posts published, study hours, habits. No account to connect and no API. Looks finished on install with demo data.
Customizable properties
- Data: one line per day, or paste two spreadsheet columns. A date alone counts as 1 and repeated dates add up
- Range: the last 4 to 53 weeks (ending today or on your last entry) or a full calendar year
- Week starts on Sunday or Monday; month labels; weekday labels (none, Mon Wed Fri, all)
- 7 color themes or your own color; 2 to 6 shades built from it (even or quantile scale)
- Stats row: total, active days, longest streak, current streak (rename or hide each)
- Legend with editable Less / More text, hover tooltip with value and date
- Cell size (fit to width or fixed), gap, cell radius, alignment
- Locale for month names, weekdays, dates and numbers
- Light / Dark, custom colors, fonts, corner radius, padding
Why this component
- Sizes itself to the width it is given, not the window. On narrow screens it leaves out the oldest weeks instead of shrinking the cells.
- Cells fill in once when scrolled into view, then stop. Canvas and static export show the finished heatmap.
- Keyboard friendly: focus the grid and use the arrow keys to read any day.
Need help?
Email hello@brandingupstudio.com — we usually reply within 1 business day. Custom edits are available from $75/hr.