What it does
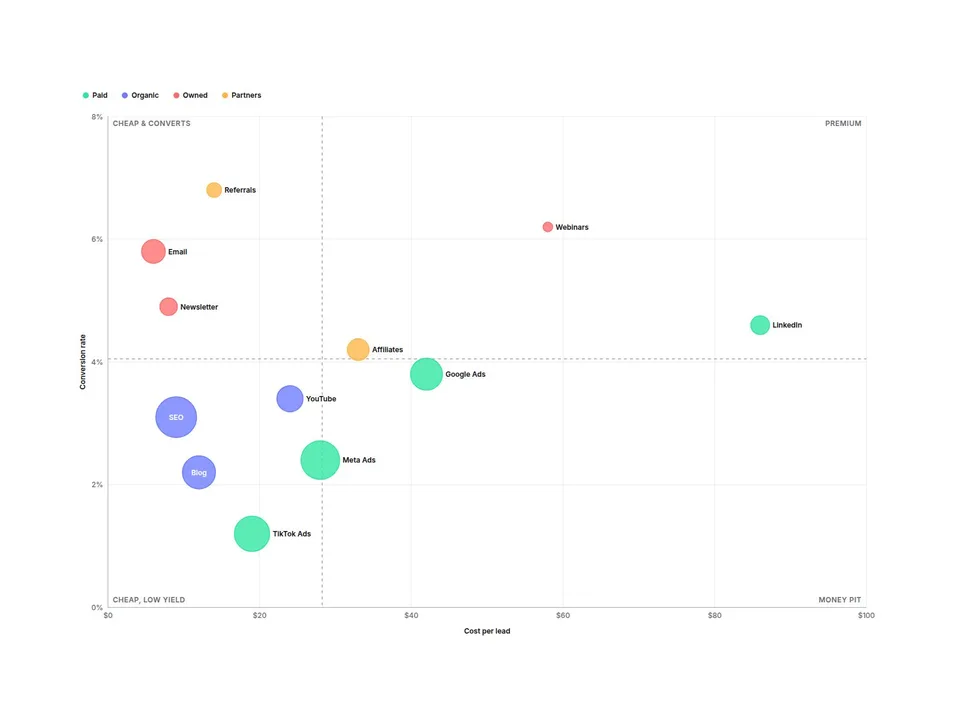
A real bubble chart for your site. Give each point an X value, a Y value and a size value, and it plots them on clean numeric axes: bubble area shows the third number, colors show the group. Looks finished on install with 12 sample marketing channels.
Customizable properties
- Points (up to 40): label, X, Y, size value and group
- Axes: titles, auto or manual range, tick count, gridlines, tick labels
- Bubbles: min / max radius, size by area or linear, opacity, labels
- 6 group colors with a legend: click a group to hide or show it
- Quadrant lines at the center, the data average or your own value, with names
- Hover tooltip with label, X, Y and size value
- Number format per value: prefix, suffix, decimals, thousands, k / M
- Light / Dark, custom colors, fonts, corner radius, padding
Why this component
- Real numbers, not an illustration: axes pick tidy tick steps for you.
- Bubbles pop in once when scrolled into view, then stop. Canvas and static export show the finished chart.
- Resizes cleanly: text stays crisp while the plot stretches.
- Keyboard focusable, with screen-reader summaries for every bubble.
Need help?
Email hello@brandingupstudio.com — we usually reply within 1 business day. Custom edits are available from $75/hr.