What it does
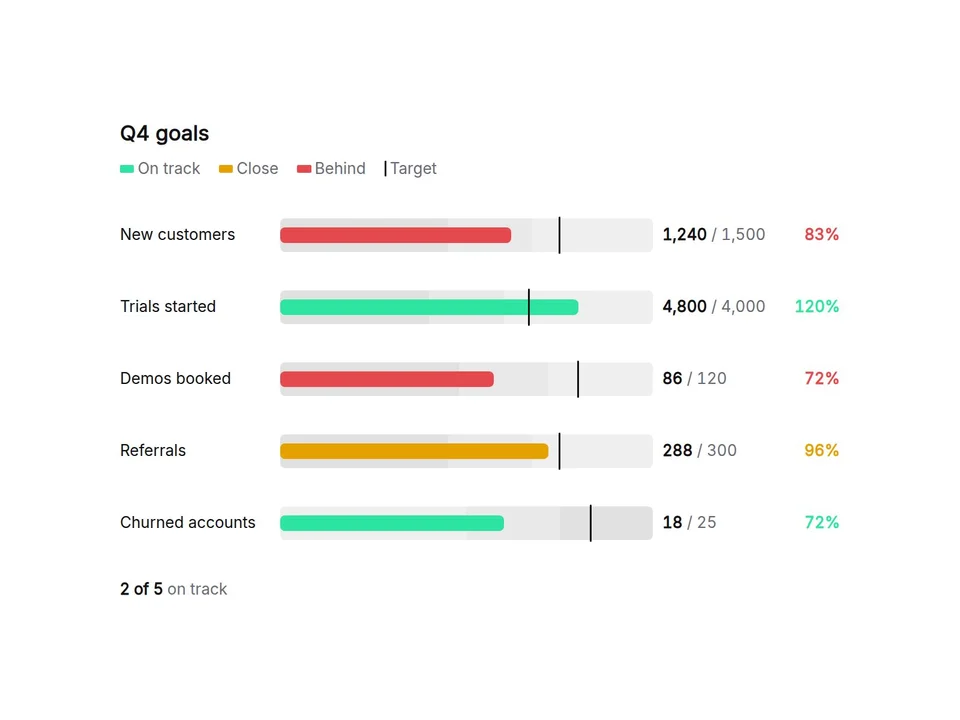
A bullet chart for goals. Type one goal per line (New customers, 1240, 1500) and each row shows the actual value as a bar, the target as a line, and shaded ranges behind it. Rows are colored On track, Close or Behind automatically, and a summary counts how many goals are on track. Looks finished on install with demo data.
Customizable properties
- Data: name, actual, target per line, or paste three spreadsheet columns
- Lower is better: end a line with "lower" for costs, churn or load time
- Close At: from what share of the target a row counts as Close
- Ranges: shaded bands behind each bar, set as % of the target
- Axis per row or shared across rows, optional axis end per line
- Sort as typed or by progress
- Values, % of target and the summary line can each be shown or hidden
- Rename every label (On track, Close, Behind, Target) for any language
- Number format: prefix, suffix, decimals, locale
- 7 color themes or your own color, light / dark, fonts, text scale, bar size and radius, hover tooltip
Why this component
- Every status and percentage is calculated from your numbers, per row.
- Sizes itself to the width it is given, not the window. On narrow screens names move above the bars.
- Bars grow once when scrolled into view, then stop. Canvas and static export show the finished chart.
- Keyboard friendly: focus the chart and use the arrow keys to read each goal.
Need help?
Email hello@brandingupstudio.com — we usually reply within 1 business day. Custom edits are available from $75/hr.