What it does
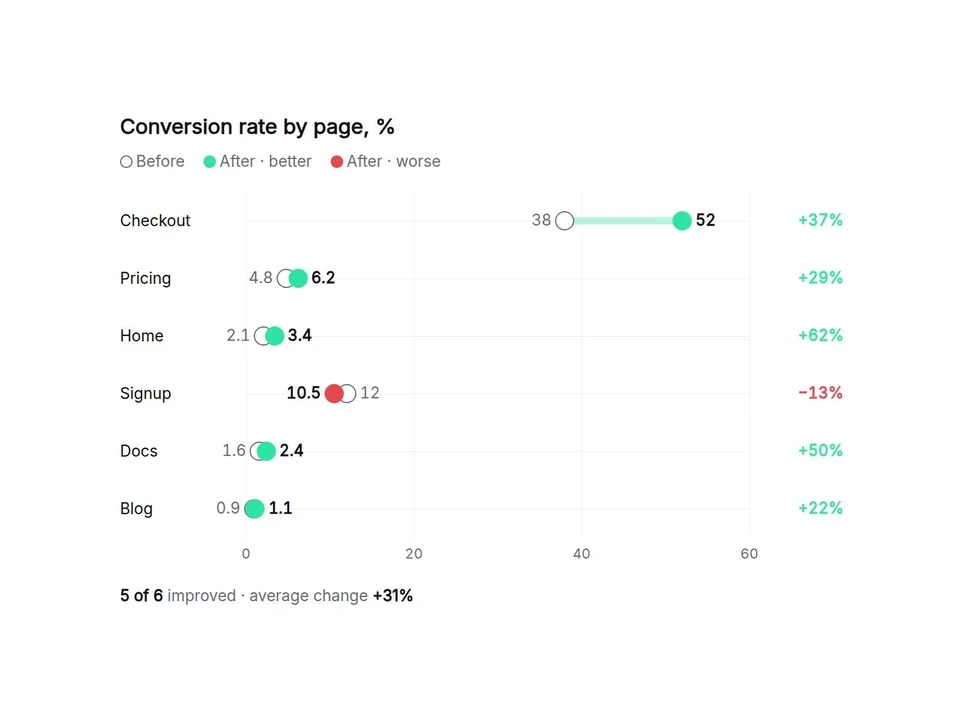
A before-and-after chart for your numbers. Type one row per line (Checkout, 38, 52) and it draws two dots joined by a bar, works out the change, and colors each row by whether it got better or worse. Switch to Slope view to show the same data as lines between two columns. Looks finished on install with demo data.
Customizable properties
- Data: name, before, after per line, or paste three spreadsheet columns
- View: dumbbell rows or slope lines
- Better: higher or lower, so a faster load time counts as an improvement
- Color by change (better / worse) or by period (before / after)
- Change shown as percent, difference or both
- Sort as typed, by change or by the after value
- Axis fitted to the data or starting at zero, with grid lines
- Summary line: how many improved and the average change
- Number format: prefix, suffix, decimals, locale
- Rename Before / After and every label, 7 color themes, light / dark, fonts, text scale, dot and bar size, hover tooltip
Why this component
- Every change is calculated from your numbers, including negative values and a before value of zero.
- Sizes itself to the width it is given, not the window. On narrow screens names move above the rows.
- Dots slide from before to after once when scrolled into view, then stop. Canvas and static export show the finished chart.
- Keyboard friendly: focus the chart and use the arrow keys to read each row.
Need help?
Email hello@brandingupstudio.com — we usually reply within 1 business day. Custom edits are available from $75/hr.