What it does
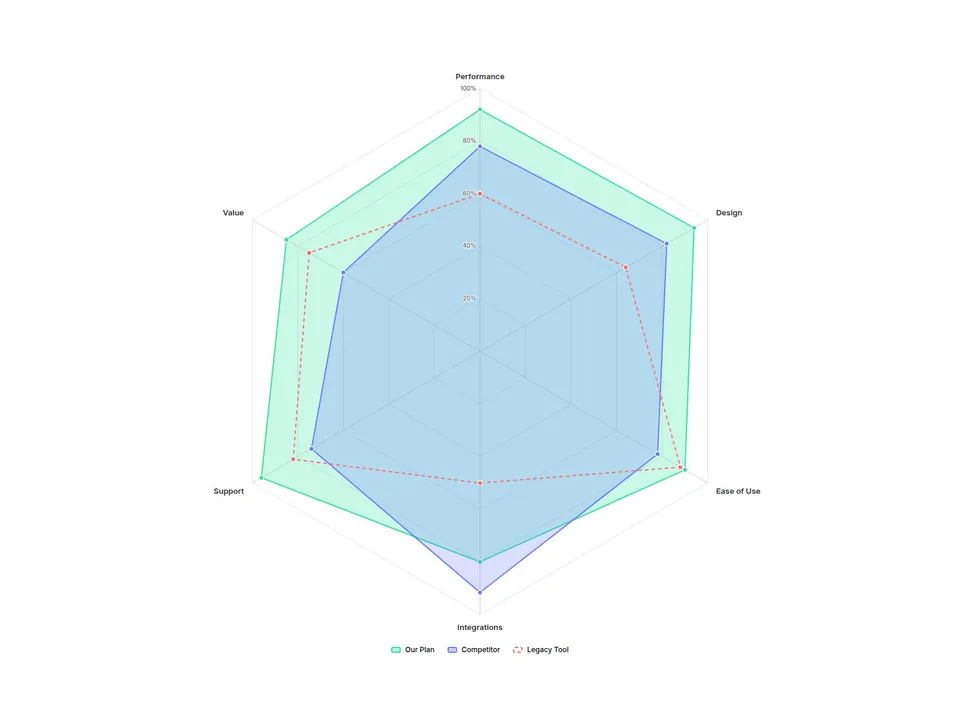
Radar Chart draws a multi-series spider chart from a simple list: name your axes, type each series' values, done. Compare plans, products or skill profiles on one polygon — even when every axis uses a different unit.
Customizable properties
- Axes — up to 12, each with label, max and unit (%, ★, $, / 100)
- Series — up to 5, each with name, values, color and style (Fill, Line, Dashed)
- Scale — Fixed, Per Axis or Auto
- Compare — Overlay or Gap 1 vs 2 (shades who leads on each axis)
- Curve — Straight or Smooth; Grid — Polygon or Circle; rings and scale labels
- Point values — Off, On Hover or Always
- Legend (bottom, top, right) with click-to-hide, tooltip, dim others
- Colors, fonts, padding, point size, line width, fill opacity
- Animate In — draws once on scroll, then morphs when values change
Why this component
- Mixed units, one chart: give each axis its own max and unit. The tooltip shows real values like 4.7★ or $1,200.
- Gap shading: switch Compare to Gap and the area between series 1 and 2 is colored by whoever is ahead — the fastest way to show "where we win".
- A legend you can use: click to hide a series, hover to spotlight it.
- Wide hover targets: hover anywhere along an axis to read every value — no pixel hunting.
- Calm by design: draws once when it scrolls into view; the editor and reduced-motion visitors see the finished chart.
- Keyboard focus and screen-reader labels on every axis.
Need help?
Email hello@brandingupstudio.com — we usually reply within 1 business day. Custom edits are available from $75/hr.