What it does
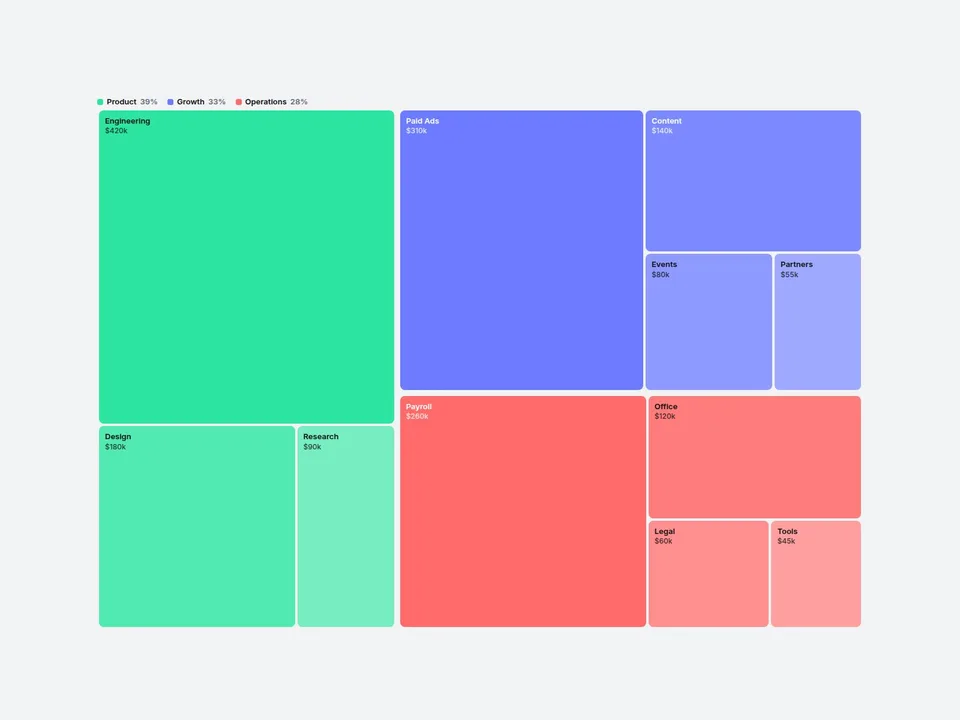
Treemap Chart turns a simple list into a treemap: each tile's area matches its value, laid out automatically. Type a label, a value and an optional group, and you're done.
Great for market share, budget breakdowns, portfolio allocation and traffic sources on SaaS, fintech and report pages.
Customizable properties
- Items — up to 30, each with label, value, group and optional color
- Layout — Grouped or Flat; Sort — by value or as typed
- Numbers — currency, suffix, thousands, decimals, k/M, show as number, percent or both
- Six group colors with automatic shading
- Legend, tooltip, hover highlight
- Gap, radius, border, padding, fonts, colors
- Animation — tiles pop in once on scroll
Why this component
- Groups made easy: same Group name, same color family. Smaller tiles get lighter shades.
- Tiny tiles handled: labels hide when too small, the tooltip still shows everything. Hover the legend to spotlight a group.
- Smooth updates: change a value or the sort and tiles glide into place.
- Calm by design: the entrance plays once, then nothing moves. The editor and reduced-motion visitors see the finished chart.
- Keyboard focus and screen-reader labels on every tile.
Need help?
Email hello@brandingupstudio.com — we usually reply within 1 business day. Custom edits are available from $75/hr.